Back to all blogs
Explore 15 recruiting benchmarks and metrics for 2026, including time to hire, cost per hire, quality of hire, and ways to improve hiring performance.


A recruiting team can fill every role on schedule and still have a broken hiring process. Roles close quickly, but new hires leave within months. Applications arrive by the thousand, but few candidates are qualified. Recruiting benchmarks are the numbers that expose gaps like these, and the 15 in this guide show where hiring slows down, where money is lost and whether new hires succeed in 2026.
Ignoring them is expensive. SHRM's 2025 benchmarking found an average cost per hire of $5,475 for nonexecutive roles and $35,879 for executive roles, yet only 20% of organizations measure quality of hire, down from 27% in 2022. Many teams track what is easy to count and skip the measures that show whether hiring actually works.
No single metric tells the full story. The most useful recruiting benchmarks cover five areas: speed, funnel performance, cost, candidate experience and post-hire outcomes. Some have reliable external reference points. Others, such as time to shortlist or pipeline health, depend on role, seniority and location, so your own historical data is the better comparison. A 30-day cycle for a high-volume role should not be judged the way you judge a 60-day executive search.
This guide explains what each of the 15 metrics measures, how to calculate it, how to read it and what to do when it moves. It also shows how to combine them into a dashboard that supports real hiring decisions.
What Are Recruiting Benchmarks?
Recruiting benchmarks are reference points used to evaluate hiring performance.
They may come from:
Industry or market data
Similar organizations
Comparable roles
Previous periods within your own organization
A recruiting metric tells you what is happening. A benchmark helps you determine whether that result is expected, improving, or potentially problematic.
Three principles make recruiting benchmarks more useful:
Compare like with like. Compare high-volume roles with similar high-volume roles rather than specialist or executive searches.
Keep definitions consistent. If one team measures time to hire from the application date while another starts from the first recruiter conversation, their results are not directly comparable.
Use external benchmarks as context. Industry figures can establish a reasonable range, while your own historical data shows whether your process is improving.
Where reliable external benchmarks exist, they can provide useful context. For metrics without meaningful universal targets, establish an internal baseline by role family and track changes consistently.
Recruiting Benchmarks and Metrics Summary
Recruiting benchmarks help organizations evaluate the efficiency, effectiveness, and overall performance of their hiring processes. By tracking key recruitment metrics, HR teams can identify bottlenecks, assess sourcing effectiveness, manage recruitment costs, and improve hiring outcomes.
The table below summarizes 15 important recruiting metrics, including what each metric measures, how to calculate or track it, and how to benchmark performance.
Metric | What it measures | How to calculate or track it | How to benchmark it |
Time to hire | Candidate-to-offer speed | Offer acceptance date − candidate entry date | External benchmarks + own trend by role |
Time to fill | Requisition-to-hire speed | Offer acceptance date − requisition open date | External benchmarks + role-specific trend |
Time to shortlist | Speed of producing qualified candidates | Shortlist date − requisition open date | Internal baseline by role family |
Qualified candidate rate | Quality of incoming candidates | Qualified candidates ÷ candidates reviewed × 100 | Compare by role and source |
Source of hire | Recruiting channel contribution | Hires from source ÷ total hires × 100 | Compare cost, speed, retention, and quality |
Sourcing-to-interview conversion | Effectiveness of sourcing | Interviewed sourced candidates ÷ total sourced candidates × 100 | Compare by recruiter, source, and role |
Interview-to-offer conversion | Interview funnel effectiveness | Offers ÷ interviewed candidates × 100 | Internal trend across similar roles |
Offer acceptance rate | Ability to convert offers into hires | Accepted offers ÷ offers extended × 100 | Internal trend by role and department |
Cost per hire | Recruiting investment | Total recruiting costs ÷ hires | External context + internal segmentation |
Recruiter productivity | Recruiting capacity and output | Hires, requisitions, interviews, or offers per recruiter | Compare similar workloads |
Candidate experience | Candidate perception | Survey, satisfaction score, or candidate NPS | Internal trend and stage-level comparison |
Candidate withdrawal rate | Voluntary candidate loss | Withdrawals ÷ candidates entering stage × 100 | Compare by stage and role |
Hiring manager satisfaction | Internal stakeholder experience | Standardized manager survey | Internal trend |
Quality of hire | Post-hire success | Performance, retention, productivity, and role outcomes | Internal trend by role and source |
Candidate pipeline health | Availability of qualified talent | Pipeline coverage and age by role | Internal thresholds by role family |
15 Recruiting Benchmarks and Metrics to Track in 2026
The following metrics cover the hiring journey from sourcing and speed through funnel performance, cost, experience, and post-hire outcomes.
They are most useful when viewed together. A fast hiring process with poor quality of hire is not necessarily successful. Neither is a low-cost process that loses qualified candidates along the way.
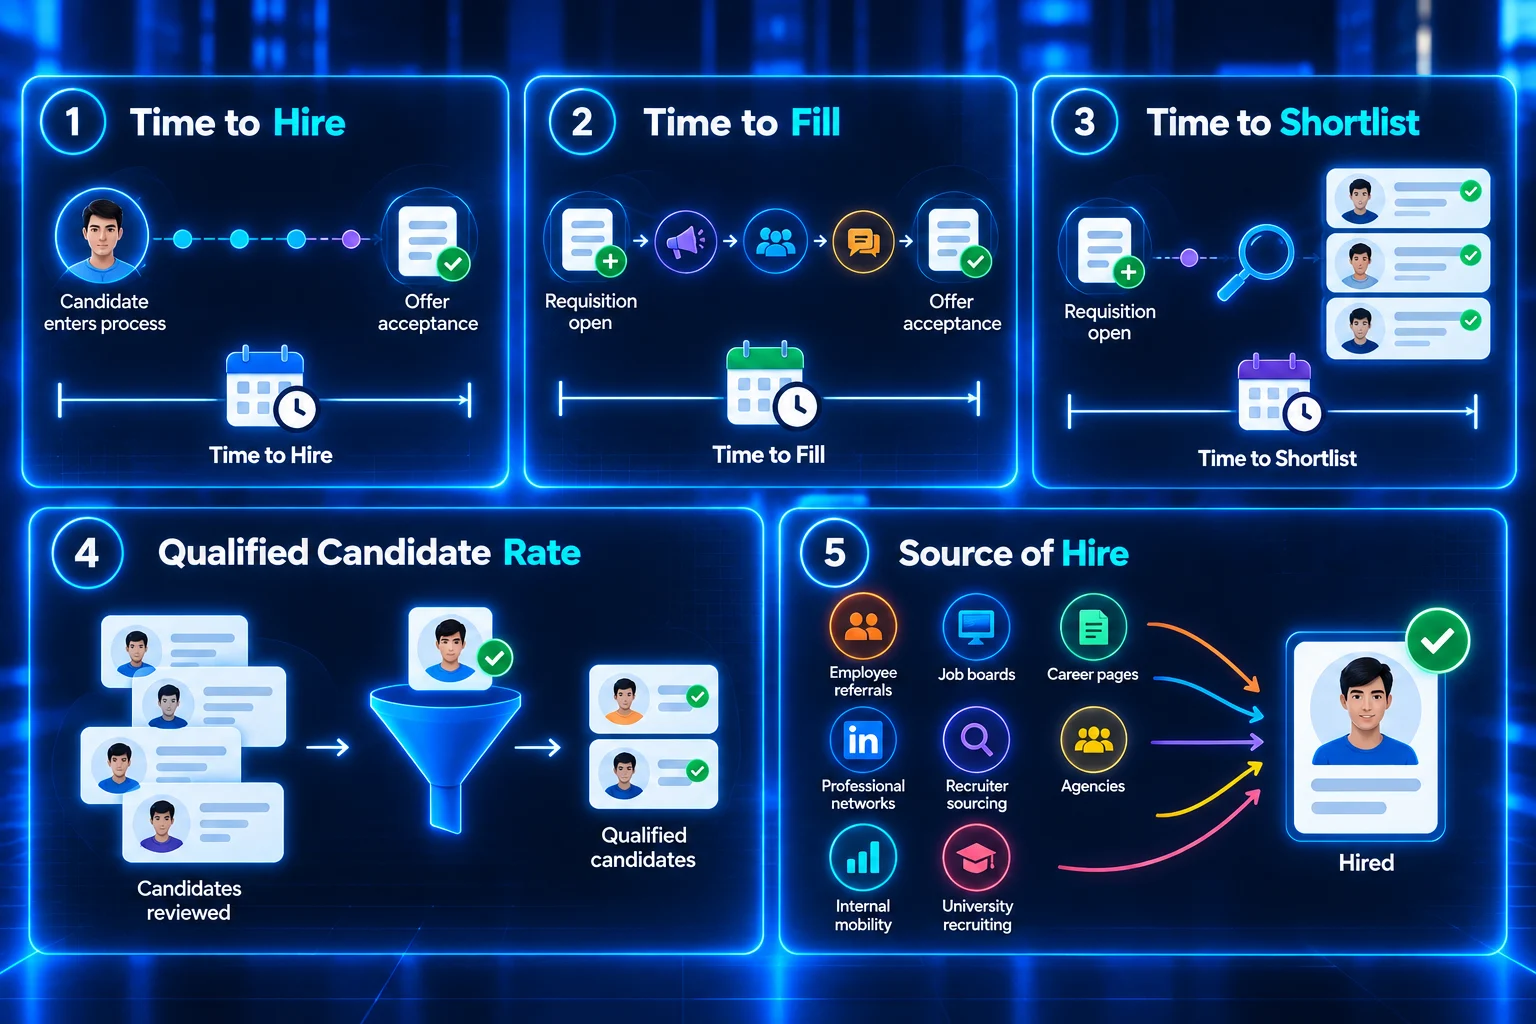
1. Time to Hire
Time to hire measures how long it takes a candidate to move through your hiring process after entering the recruitment funnel.
Time to hire = Offer acceptance date − Candidate entry date
The important part is defining what "candidate entry" means.
Some organizations begin counting from the application date. Others start when a sourced candidate enters an active hiring process. Whichever definition you choose, apply it consistently.
For context, Tellent's State of Hiring report, based on 2024 data from more than 5,000 companies, reported a global average time to hire of 40.1 days, with larger organizations closer to 28 days.
A rising time to hire should prompt you to investigate individual stages rather than assume the whole recruitment process is slow.
Break it down into:
Recruiter screening
Assessments
Interview scheduling
Interview rounds
Hiring manager feedback
Approval
Offer preparation
For example, if candidates wait two days for a recruiter screen but nine days for hiring manager feedback after the final interview, increasing sourcing activity will not solve the problem. A faster feedback process might.
Track time to hire by role, department, seniority, location, and candidate source so you can distinguish process delays from roles that naturally take longer to fill.
2. Time to Fill
Time to fill measures how long an approved position remains open.
Time to fill = Offer acceptance date − Requisition open date
Unlike time to hire, time to fill begins before a candidate enters the process. It can include:
Requisition approval
Job posting
Sourcing
Candidate screening
Interviews
Compensation decisions
Offer approval
SHRM's 2025 recruiting data placed the median time to fill at roughly a month and a half for both executive and nonexecutive roles.
The real value comes from comparing time to fill with time to hire.
Time to fill is much higher than time to hire: The delay may be occurring before candidates enter the active process, such as during approvals, job posting, or early sourcing.
Both are high: Candidate availability, compensation, location, or skill scarcity may be contributing.
Time to fill is high only for certain roles: Those roles may require a different sourcing strategy.
A long time to fill is not automatically a problem. The more useful question is how much of that time was avoidable.
3. Time to Shortlist
Time to shortlist measures how quickly recruiters produce the first group of candidates who meet the agreed requirements for a role.
Time to shortlist = Qualified shortlist submission date − Requisition open date
This is a useful early warning metric because it can reveal sourcing problems before they affect the final hiring timeline.
A role that produces a qualified shortlist within three days but takes 45 days to fill has a different problem from one that takes three weeks to produce viable candidates.
The first may indicate interview, feedback, or approval delays. The second may point to problems with the talent pool or sourcing strategy.
When time to shortlist rises, review:
Whether job requirements match available talent
Whether compensation is competitive for the role and location
Whether sourcing channels fit the target candidate profile
Whether the recruiter has enough capacity to work the role effectively
Define what qualifies as a shortlisted candidate before the search begins.
You can also track the percentage of shortlisted candidates approved for interview by the hiring manager. A fast shortlist with a low approval rate may indicate speed without sufficient accuracy.
4. Qualified Candidate Rate
Qualified candidate rate measures the percentage of candidates who meet the agreed requirements at a defined stage of the hiring process.
Qualified candidate rate = Qualified candidates ÷ Candidates reviewed at the same stage × 100
Always specify the stage.
A qualified candidate rate calculated from all applicants cannot be directly compared with one calculated after recruiter screening because the second group has already been filtered.
The metric becomes especially useful when segmented by candidate source.
For example:
A job board produces 400 applications and 20 qualified candidates: 5% qualified candidate rate
Employee referrals produce 30 applications and 12 qualified candidates: 40% qualified candidate rate
The job board produces more volume, while referrals generate more qualified candidates relative to the number reviewed.
Compare qualified candidate rates across:
Job boards
Employee referrals
Outbound sourcing
Agencies
Internal candidates
Career pages
If the rate is low, review the job description, qualification criteria, compensation, and sourcing channels.
If it is unusually high after recruiter screening, also check whether your screening criteria are too broad. Weak filtering early in the funnel can simply move the problem to the interview stage.
5. Source of Hire
Source of hire shows which recruiting channels produce successful hires.
Source of hire percentage = Hires from a specific source ÷ Total hires × 100
Common sources include:
Employee referrals
Career pages
Job boards
Professional networks
Recruiter sourcing
Recruitment agencies
Internal mobility
University recruiting
The percentage of hires from each source is only the starting point.
Evaluate each source across the full recruiting funnel:
Candidates generated
Qualified candidates
Interviews
Offers
Hires
Cost
Time to hire
Retention
Quality of hire
This prevents a high-volume source from appearing successful simply because it produces many applications.
Attribution also needs a consistent rule. A candidate may discover a role through one channel and eventually apply through another.
Decide whether you will use first-touch attribution, last-touch attribution, or record multiple touchpoints where your recruiting system allows it.

6. Sourcing-to-Interview Conversion Rate
Sourcing-to-interview conversion rate measures how many sourced candidates progress to an interview.
Sourcing-to-interview conversion rate = Sourced candidates reaching interview ÷ Total sourced candidates × 100
A low conversion rate may indicate:
Poor candidate targeting
Weak outreach messaging
Uncompetitive compensation
Low candidate interest
A difficult-to-sell role
Track the rate by recruiter, role family, source, and outreach approach.
If two recruiters working on similar roles have significantly different conversion rates, the difference may be related to targeting or messaging rather than the overall labor market.
A very high conversion rate also deserves attention. If almost every sourced candidate reaches interview, your initial qualification criteria may be too broad.
Read this metric alongside qualified candidate rate and interview-to-offer conversion rate.
For outbound sourcing teams, candidate response rate and positive response rate can also provide useful supporting context.
7. Interview-to-Offer Conversion Rate
Interview-to-offer conversion rate measures the percentage of interviewed candidates who receive an offer.
Interview-to-offer conversion rate = Offers extended ÷ Candidates interviewed × 100
There is no universal target that works across every role and organization.
The most useful comparison is your own historical performance across similar positions.
A declining interview-to-offer rate can indicate:
Lower candidate quality entering interviews
Unclear or changing hiring criteria
Misalignment between recruiters and hiring managers
Inconsistent interviewer standards
Too many candidates reaching interviews before adequate screening
If the rate is low while the number of interview rounds continues to increase, the process may be adding activity without improving decision quality.
More interviews do not necessarily produce better decisions unless each stage evaluates something different.
Structured interview guides and shared evaluation criteria can help interviewers assess candidates more consistently.
8. Offer Acceptance Rate
Offer acceptance rate measures the percentage of formal job offers that candidates accept.
Offer acceptance rate = Accepted offers ÷ Offers extended × 100
This metric helps show how effectively your organization converts final candidates into hires.
Gartner's 2Q25 candidate survey found that 51% of candidates said they accepted a job offer in their most recent application process, compared with 74% in 2Q23.
This provides useful context about candidate-market behavior, but it should not be treated as a direct benchmark for your organization's own offer acceptance rate.
Your internal trend is often more useful.
Record why candidates decline offers and categorize the reasons, such as:
Compensation or benefits
Location or work arrangement
Role scope
Job title
Competing offer
Career development
Hiring process delays
Then segment offer acceptance by department, hiring manager, recruiter, role type, and location.
Repeated declines within one area may reveal problems with compensation, role positioning, approval speed, or candidate expectations.
The work of improving offer acceptance also begins before the offer. Discussing compensation expectations, work arrangements, role scope, and candidate priorities earlier in the process can reduce late-stage surprises.
9. Cost per Hire
Cost per hire measures the average recruiting cost required to make a hire.
Cost per hire = Total recruiting costs ÷ Number of hires
Define which recruiting costs are included before reporting the metric.
These may include:
Recruiter compensation allocated to hiring
Job advertising
Job board fees
Agency fees
Assessments
Background checks
Recruiting software
Career events
Travel
Referral bonuses
Because costs vary significantly by seniority and role type, avoid combining every hire into a single organization-wide average without segmentation.
Track cost per hire by:
Role family
Seniority
Location
Recruiting source
Department
Where useful, also consider cost per qualified candidate by sourcing channel. A source that delivers inexpensive applications may still create unnecessary recruiter workload if very few candidates meet the requirements.
Cost per hire becomes more meaningful when viewed alongside retention and quality of hire.
A low-cost source is not efficient if the resulting hires leave quickly or consistently underperform.
10. Recruiter Productivity
Recruiter productivity measures recruiting output or workload over a defined period.
Common measures include:
Hires per recruiter
Requisitions per recruiter
Qualified candidates per recruiter
Interviews generated per recruiter
Offers made per recruiter
Time spent per requisition
There is no meaningful universal productivity target because recruiter workloads vary significantly.
A recruiter responsible for high-volume customer service hiring cannot be fairly compared with someone managing a small number of specialist or executive searches.
Evaluate recruiter productivity alongside:
Role complexity
Hiring volume
Time to fill
Candidate quality
Candidate experience
If workloads increase while time to fill also rises, the recruiting team may be overloaded.
If output rises while candidate experience declines, recruiters may also be carrying more work than the process can support effectively.
Use productivity metrics primarily to understand capacity, allocate resources, and identify process bottlenecks rather than to rank recruiters solely on hiring volume.

11. Candidate Experience Score
Candidate experience measures how applicants perceive different parts of the recruitment process.
Organizations can measure it through short surveys following important stages such as:
Application
Recruiter screening
Assessment
Interview
Rejection
Offer
Some teams use an NPS-style question asking how likely a candidate is to recommend applying to the organization.
Under that method:
Scores of 9-10 are promoters
Scores of 0-6 are detractors
Candidate NPS = % promoters − % detractors
However, NPS is only one way to measure candidate experience.
Organizations may also track:
Satisfaction ratings
Communication scores
Interview experience
Application ease
Qualitative feedback
Stage-level measurement is particularly useful because one poor interaction can be hidden within an overall score.
For example, candidates may rate interviews highly but still leave with a poor overall impression because they waited two weeks for an outcome.
According to Survale’s 2025 Candidate Experience Benchmark Research, which analyzed over 66,000 candidate responses, providing specific feedback was associated with a 69% increase in candidates’ willingness to recommend the employer to others.
Keep candidate surveys short, use consistent questions, and review written feedback alongside the numerical score.
12. Candidate Withdrawal Rate
Candidate withdrawal rate measures the percentage of candidates who voluntarily leave the recruitment process before completing it.
Candidate withdrawal rate = Candidates who voluntarily withdraw from a stage ÷ Candidates entering that stage × 100
Separating candidate withdrawals from employer rejections is important.
A candidate rejected after an interview provides information about selection quality. A qualified candidate who withdraws because interview scheduling took two weeks provides information about the candidate experience and process speed.
Track withdrawals separately across stages such as:
Application
Screening
Assessment
Interview
Final interview
Offer
Common causes include:
Long application processes
Slow scheduling
Unclear compensation
Too many interview rounds
Poor communication
Long waits between stages
Competing opportunities
Record the reason whenever possible.
Then compare withdrawal rates with time spent in each stage.
If candidate withdrawals consistently rise after long waiting periods, reducing delays may improve the hiring funnel more effectively than increasing sourcing activity.
13. Hiring Manager Satisfaction
Hiring manager satisfaction measures how managers perceive recruiting support and outcomes.
A short recurring survey can cover:
Candidate quality
Recruiting speed
Communication
Understanding of the role
Interview coordination
Overall recruiting partnership
Use consistent questions so results can be compared over time.
Consider surveying managers at two points:
After the shortlist: to understand whether recruiting correctly interpreted the role requirements.
After the hire: to understand whether the recruiting process ultimately delivered the right candidate.
Do not use hiring manager satisfaction as a standalone measure of recruiting performance.
A manager may be satisfied because candidates arrive quickly even when the resulting hires perform poorly.
Pair the metric with:
Qualified candidate rate
Time to fill
Candidate experience
Quality of hire
Persistently low satisfaction may indicate that recruiters and hiring managers have different definitions of what a qualified candidate looks like.
A structured intake or kickoff conversation at the beginning of each search can help establish clearer expectations.
14. Quality of Hire
Quality of hire measures whether employees hired through the recruiting process succeed after joining the organization.
There is no universal formula because success looks different across roles.
Common inputs include:
Performance ratings
Time to productivity
Retention
Hiring manager assessment
Goal attainment
Role-specific performance outcomes
A sales organization might emphasize quota attainment, while a customer support team may place greater weight on productivity, service quality, and retention.
One simple model is to convert two or three relevant measures into comparable scores and combine them.
For example:
Quality of hire score = (Performance score + Retention score + Hiring manager score) ÷ 3
The exact formula matters less than using a consistent method.
A practical way to begin is:
Select two or three measures you already collect.
Define fixed measurement periods, such as 90 days, six months, and 12 months.
Connect each hire to their recruiting source, recruiter, and hiring manager.
Review the results quarterly.
Compare quality across roles and recruiting channels.
Quality of hire is especially important because optimizing recruiting solely for speed or volume can create poor long-term hiring outcomes.
15. Candidate Pipeline Health
Candidate pipeline health is an internal benchmark that shows whether you have enough qualified candidates to support current and expected hiring needs.
Useful indicators include:
Qualified candidates per open role
Active candidates per role
Candidates by funnel stage
Pipeline age
Interview-ready candidates
Roles without a qualified shortlist
Roles with no recent qualified candidates entering the pipeline
There is no universal number of candidates that every role should have.
Pipeline requirements depend on:
Role type
Seniority
Location
Compensation
Hiring volume
Talent availability
Set internal coverage thresholds by role family instead.
For example, a recruiting team might flag a critical role when it has fewer than a defined number of interview-ready candidates.
Pipeline age is also important.
A large pipeline is less useful if many candidates have not been contacted in months and are no longer interested or available.
Used this way, candidate pipeline health becomes a forward-looking measure that can identify future hiring risks before they affect time to fill.
How to Turn Recruiting Metrics Into Better Hiring Decisions
Tracking 15 recruiting metrics does not mean every stakeholder needs to see all 15 at once.
A useful recruiting dashboard connects each metric to a decision.
Give Each Metric a Purpose
Different stakeholders need different views of recruiting performance.
Leadership teams may focus on:
Time to fill
Cost per hire
Quality of hire
Offer acceptance rate
Hiring volume
Pipeline health
These metrics provide a high-level view of recruiting efficiency and hiring outcomes.
Recruiters and recruiting managers may need:
Time to shortlist
Qualified candidate rate
Sourcing-to-interview conversion
Interview-to-offer conversion
Candidate withdrawal rate
Recruiter productivity
Pipeline age
These measures help identify where individual hiring processes are slowing down or losing candidates.
Matching metrics to the decisions people need to make helps prevent recruiting dashboards from becoming overloaded.
Set a Review Rhythm
Not every recruiting metric should be reviewed at the same frequency.
Fast-moving funnel metrics may require weekly attention, while long-term outcomes such as quality of hire need more time before they become meaningful.
Review frequency | Metrics to review |
Weekly | Funnel conversion, pipeline age, time in stage, candidate withdrawals |
Monthly | Time to fill, offer acceptance, recruiter productivity, candidate experience |
Quarterly | Quality of hire, source effectiveness, cost per hire, hiring manager satisfaction |
The exact schedule can vary depending on hiring volume, but using a consistent review rhythm makes changes easier to spot.
Segment Before Drawing Conclusions
Organization-wide averages can hide important differences.
Whenever possible, segment recruiting data by:
Role family
Seniority
Department
Location
Recruiter
Hiring manager
Candidate source
For example, an organization-wide increase in time to fill may appear concerning until you discover that the change comes entirely from a small number of specialist positions.
Segmentation helps identify whether a problem affects the entire recruiting process or only a specific part of it.
Look at Metrics Together
Recruiting metrics become more useful when interpreted as a system rather than in isolation.
For example:
Time to fill increases + time to shortlist increases
The problem may be sourcing or candidate availability.
Time to fill increases + time to shortlist remains stable
The bottleneck may be interviews, feedback, or approvals.
Offer acceptance falls + candidate withdrawals increase
Candidate expectations, compensation, communication, or process speed may need attention.
Cost per hire falls + quality of hire falls
The lower recruiting cost may not represent genuine efficiency.
Recruiter workload rises + time to fill rises
The recruiting team may be approaching or exceeding its available capacity.
This is why optimizing one metric alone can produce misleading results.
Four Questions Your Recruiting Dashboard Should Answer
A useful recruiting dashboard should make four things clear:
Are we filling roles at an appropriate speed?
Are qualified candidates moving efficiently through the hiring funnel?
Are we using recruiting resources effectively?
Are the people we hire succeeding after they join?
If a metric does not help answer one of these questions or support a specific recruiting decision, it may not need to be on the main dashboard.
Conclusion
Recruiting benchmarks are most useful when they provide context for recruiting metrics rather than becoming universal targets that every role is expected to hit.
External benchmarks can help you understand the wider market, but internal comparisons are equally important. Compare similar roles, use consistent definitions, segment the data appropriately, and investigate meaningful changes rather than reacting to one organization-wide number.
A strong recruiting dashboard does not need every possible metric. It needs enough reliable information to show where hiring slows down, where qualified candidates are lost, how recruiting resources are being used, and whether new hires ultimately succeed.
As a practical starting point, choose five metrics that matter most to your current hiring goals. Define exactly how each one is calculated, establish a baseline using recent hiring data, assign an owner, and review the results on a consistent schedule.
Once those measures are reliable, add additional metrics only where they help answer a specific recruiting question.